Ensuring your custom pixel functions correctly on Shopify checkout pages is crucial for accurate e-commerce event tracking. Given Shopify’s sandbox environment for payment security, GTM’s preview mode isn’t available on checkout pages. However, you can use Chrome DevTools to debug. Here’s a step-by-step guide to help you test Analyzify’s custom pixel effectively.
Step 1: Access Customer Events
First, navigate to your Shopify settings and locate the Customer Events page. Under the Custom Pixels section, find Analyzify. It’s important to note the type should be “Custom” and not “App.”
Step 2: Enable Debug Mode
Click on your custom pixel script and scroll to find the following lines:
-
const debug = { -
status: true,
Make sure this value is set to true and that your custom pixel is properly connected to your store.
Step 3: Prepare for Debugging
Next, go to your website, add a product to your cart, and proceed to the checkout page. Make sure to accept any cookie banners if they appear.
Step 4: Start Debugging
You have two primary methods for debugging: Network panel and Console panel.
The first method to debug your setup is to check the requests sent via the Network tab. However, in addition to Network requests, checking the logs pushed to the Console by Analyzify Custom Pixel will provide a more definitive result.
4.1 - Debug with Network
1. Press
CTRL + SHIFT + I (Windows)
or
Shift-Command-K (Mac)
to open Chrome Dev Tools.
2. Then go to the “Network” panel.
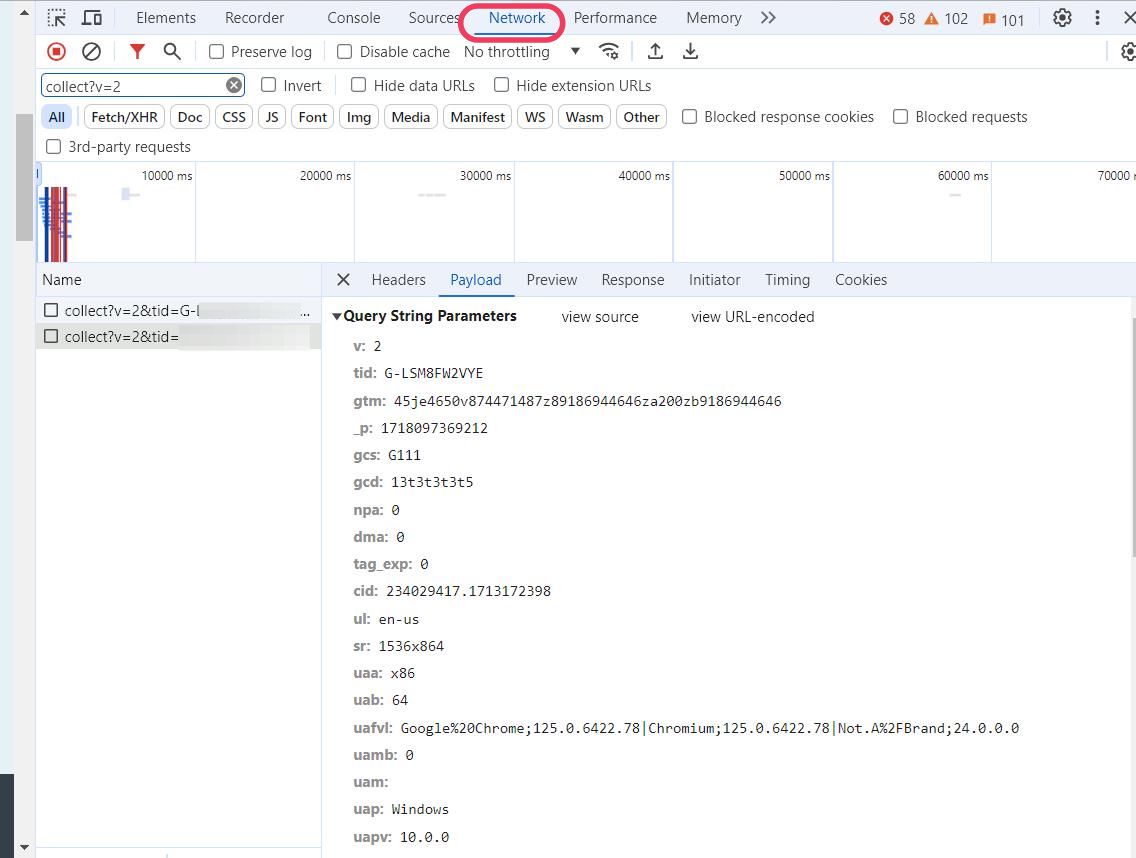
Type your GA4 Measurement ID or collect?v=2 in the filter box to see Google Analytics (GA4) event signals.
3. Start filling in the contact email, shipping address, etc. Make sure to fill every necessary section, otherwise, the event might not be fired.
4. Click the related result ( on the left part ) then check the “payload” panel on the right. You will see something like en:add_contact_info (“ en ” is for e vent n ame)
4.2 - Debug with Console
1. Press Ctrl + Shift + Enter (Windows) or CMD + Option + J (Mac) to open the Console window.
2. Start filling in the contact email, shipping address, etc. Make sure to fill every necessary section, otherwise, the event might not be fired.
3. You will see events like ee_page_view, ee_contact_info, etc.
Debug Results
Now, let's check how these events appear on both the Network and Console.
Add your email address first, then check to see if the ee_add_contact_info event fires.
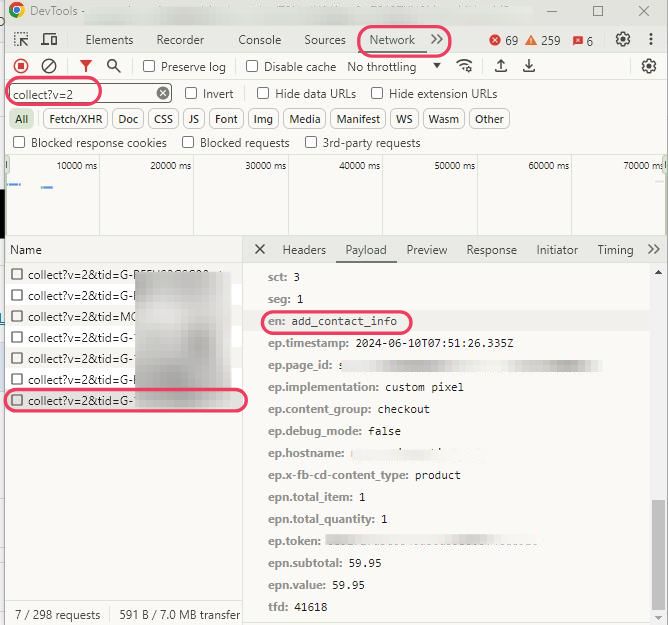
Add your email address first, then check to see if the ee_add_contact_info event fires.

When you fill out this section, the ee_add_address_info event should be pushed to the dataLayer.
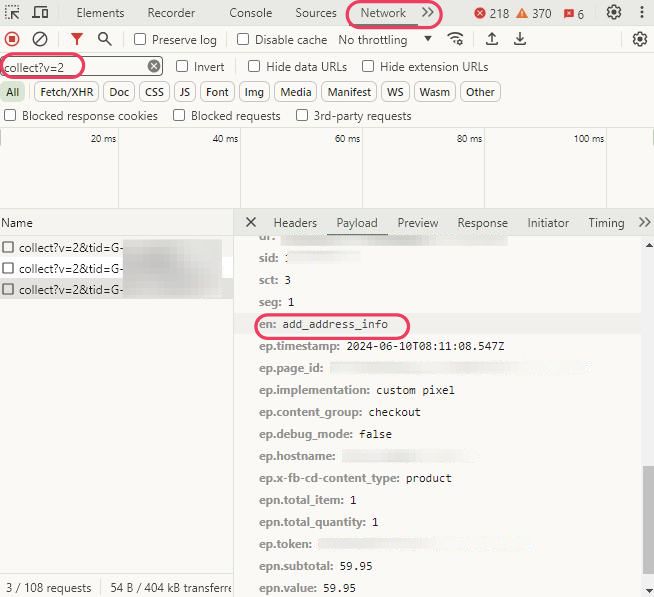
When you fill out this section, the ee_add_address_info event should be pushed to the dataLayer.

When you choose your shipping method and proceed to enter the payment details, the ee_add_shipping_info event should be triggered.
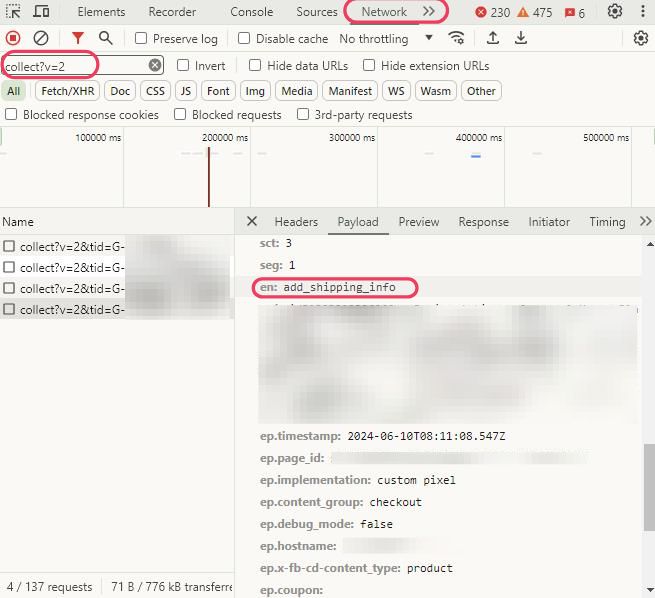
When you choose your shipping method and proceed to enter the payment details, the ee_add_shipping_info event should be triggered.

Enter your payment details now and initiate the transaction to see if the ee_add_payment_info event is triggered.
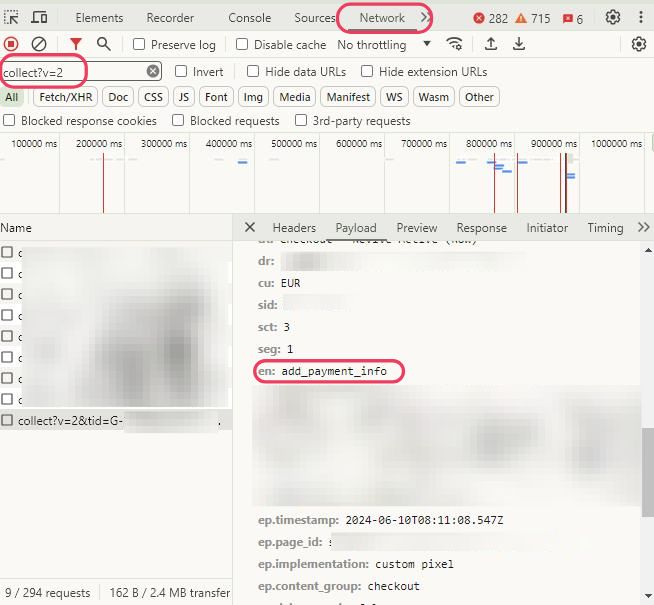
Enter your payment details now and initiate the transaction to see if the ee_add_payment_info event is triggered.

Lastly, you can use the <a href=”https://help.shopify.com/en/manual/checkout-settings/test-orders”>Bogus method</a> or a 100% discount code to test if the ee_purchase event is working.
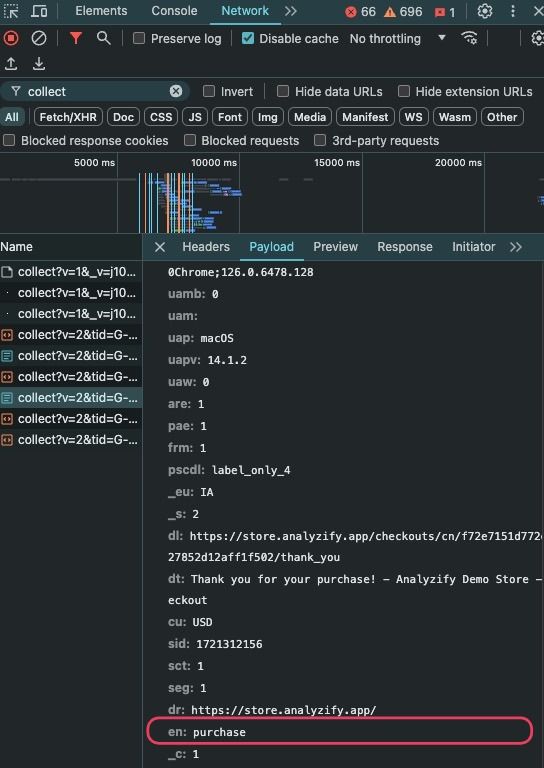
Lastly, you can use the <a href=”https://help.shopify.com/en/manual/checkout-settings/test-orders”>Bogus method</a> or a 100% discount code to test if the ee_purchase event is working.

By following these steps, you can effectively debug Analyzify’s custom pixels on Shopify checkout pages, ensuring accurate tracking of all e-commerce events.
