Understanding your store’s marketing performance shouldn’t require checking multiple platforms or piecing together reports from different tools. Analyzify’s Unified Marketing Analytics for Shopify brings your essential data into one dashboard—right inside your Shopify admin.
This guide walks through the key features included in the unified analytics dashboard and how they can help streamline reporting and improve decision-making.
All Key Reports, One Place
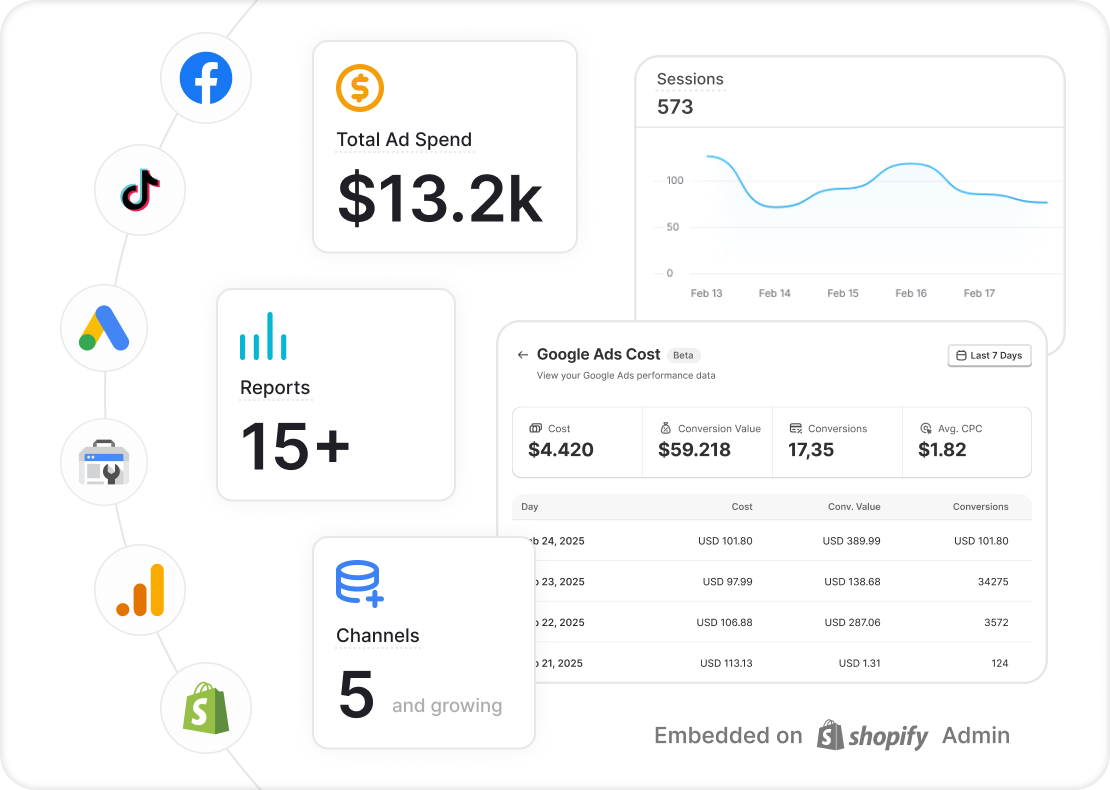
With Analyzify’s dashboard, you no longer need to switch between GA4, Google Ads, Meta, Tiktok, Search Console, and Shopify. Each platform’s essential reports are centralized, giving you a clear overview of your marketing and sales performance.
GA4 Reports in Shopify
Google Analytics 4 offers powerful insights, but its complexity often makes it difficult to access key metrics quickly. Analyzify simplifies this by displaying your core GA4 reports within Shopify, including:
- Session trends and traffic sources
- Top-performing products by pageviews
- Revenue generated by referral channels
- Session trends and traffic sources
- Total users and number of purchases
- Top-performing products by pageviews
- Items viewed, added to cart, and purchased
- Revenue generated by referral channels
- Daily user/session trend charts and referral breakdowns
This makes it easier to see what’s working and where your traffic is coming from, without needing to log into GA4.
Google Ads Reporting
Analyzify also integrates your Google Ads data directly into Shopify. You can monitor ad spend, conversions, and top-performing campaigns—all within the context of your store’s performance.
Analyzify integrates your Google Ads data directly into Shopify. You’ll see:
- Impressions, clicks, CTR, and Avg. CPC
- Ad spend, conversions, and cost per conversion
- Conversion value and ROAS
- Top-performing campaigns with full metric breakdowns
- A daily ad spend vs. conversion value graph
This connection allows for better alignment between advertising costs and actual sales, helping you evaluate return on ad spend more effectively.
Shopify Sales Data
While Shopify provides built-in reports, Analyzify’s dashboard enhances this by aligning your core sales data with your marketing efforts. It includes:
- Total sales and order volume
- Average order value (AOV)
- Sales breakdowns by order
- Total sales, net sales, and order volume
- Discounts, returns, shipping, and taxes
- Average order value (AOV) and product quantity per order
- Daily charts showing trends in sales, AOV, and returns
Seeing this alongside ad and traffic data gives a fuller picture of what's driving revenue.
Meta (Facebook and Instagram) Reports
Analyzify brings your Meta ad data into the dashboard as well. This includes:
- Total ad spend
- Click and engagement metrics
- Website purchases and conversion performance
- Total ad spend, impressions, clicks, and CTR
- CPC, cost per result (CPR), and conversion value
- Website purchases and ROAS
- Daily cost, click, and conversion charts
- Top campaign performance tables with optimization signals
Having these metrics inside Shopify allows you to directly compare Meta performance with your store’s sales.
TikTok Ad Reports
TikTok performance data can be hard to monitor across separate dashboards. Analyzify simplifies this by bringing key TikTok ad metrics directly into your Shopify dashboard, such as:
- Total ad spend per campaign
- Impressions, clicks, CTR, and CPC
- Conversions, CPA (Cost per Acquisition), and ROAS
- CVR (Conversion Rate) and CPM (Cost per 1,000 impressions)
- Daily spend and conversion trend charts
- Top-performing TikTok campaigns by conversion value
These reports help you understand how your TikTok ads contribute to traffic and revenue, alongside your other channels.
These insights can be used to refine your targeting, optimize creatives, and improve your ad spend efficiency—without needing to switch platforms.
Search Console Integration
Search Console data can often be difficult to interpret. Analyzify simplifies this by pulling key metrics into your dashboard, such as:
- Total clicks from Google Search
- Top search queries
- Most-clicked content and product pages
- Total clicks and impressions from Google Search
- CTR and average search position
- Top search queries and best-performing pages
- Clicks & impressions graph for trend tracking These reports help you spot SEO opportunities more easily.
These insights can be used to inform your SEO strategy without needing to rely on separate tools.
Built on Accurate, Reliable Tracking
The dashboard works in tandem with Analyzify’s robust tracking setup. This includes:
- Expert installation and data validation
- Server-side tracking for GA4, Meta, and TikTok
- Custom data layers for advanced tracking
- Privacy compliance features like Google Consent Mode
- Support for multi-store tracking
- Full TikTok tracking and attribution built into the dashboard
The result is a reporting experience that’s not only centralized but also grounded in clean, reliable data.
Summary
Analyzify’s Unified Marketing Analytics for Shopify is designed to give merchants a streamlined view of their marketing and store performance. By combining key reports from multiple platforms into one dashboard, it helps reduce complexity and improve clarity across your data.
To explore each section in more depth, you can read the full feature article here:
🔗 Unified Marketing Analytics for Shopify – Full Feature Breakdown